PJM raises their long-term load forecast (again)
January 18, 2026
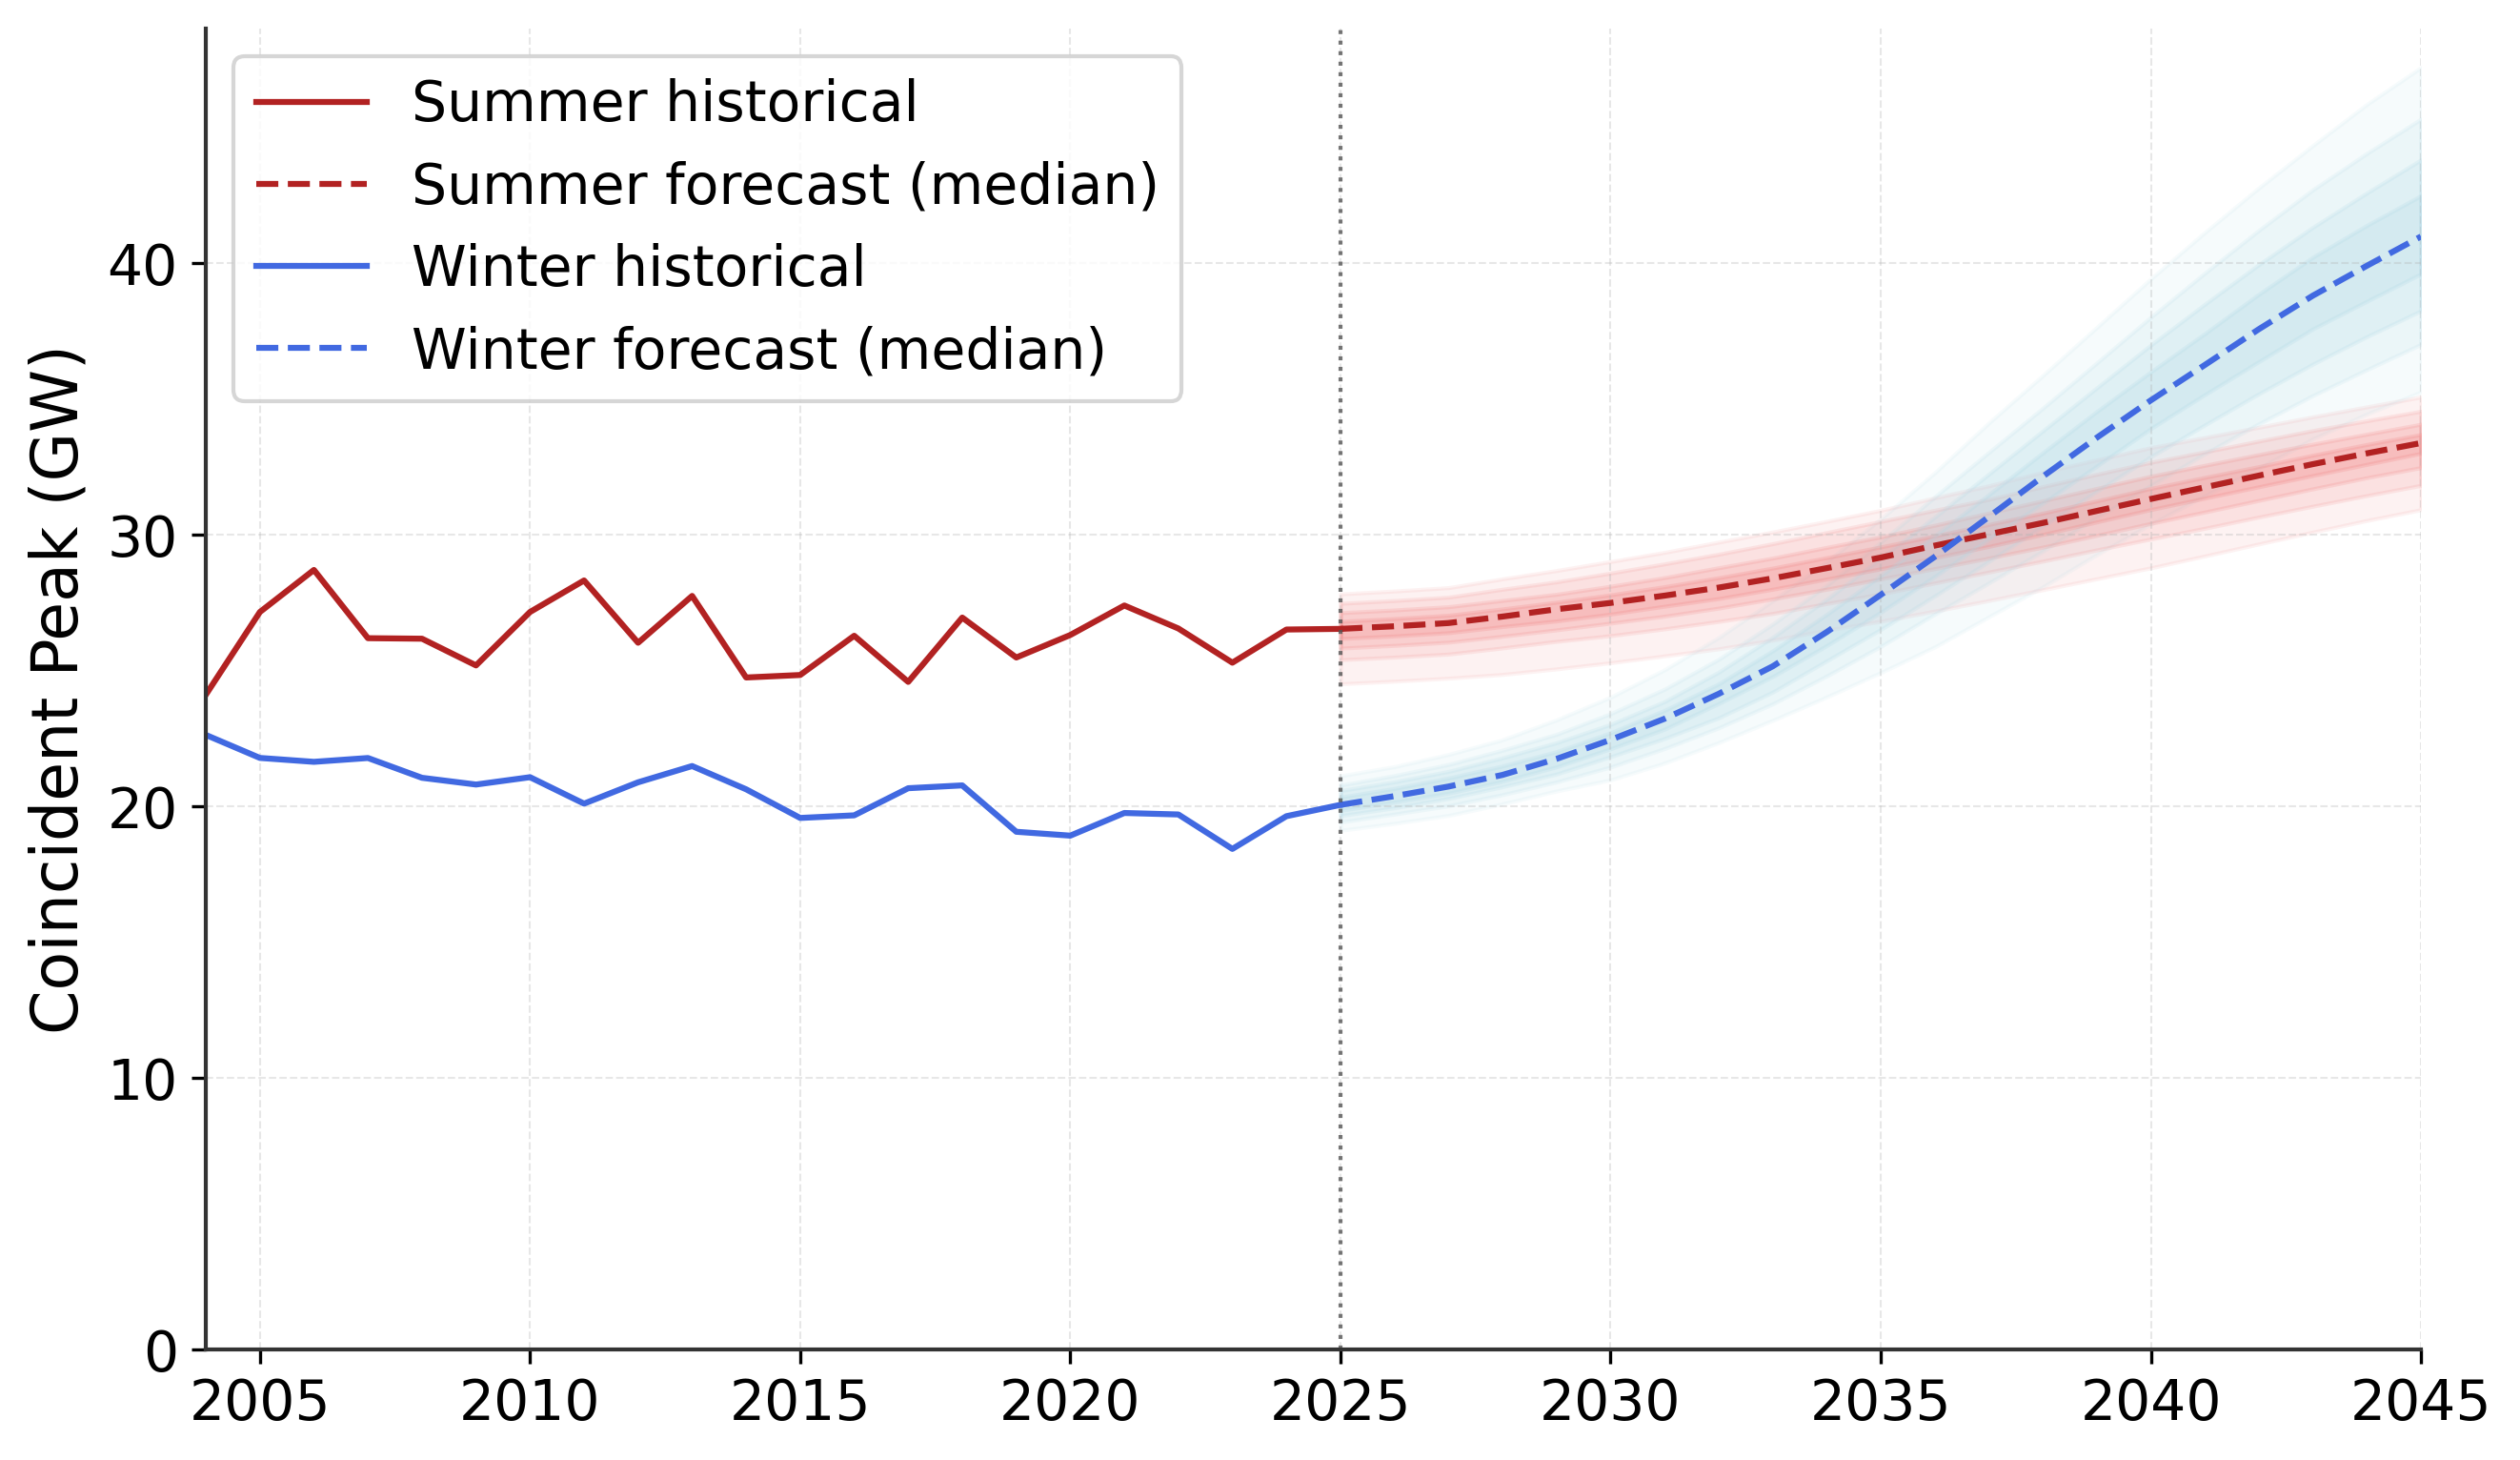
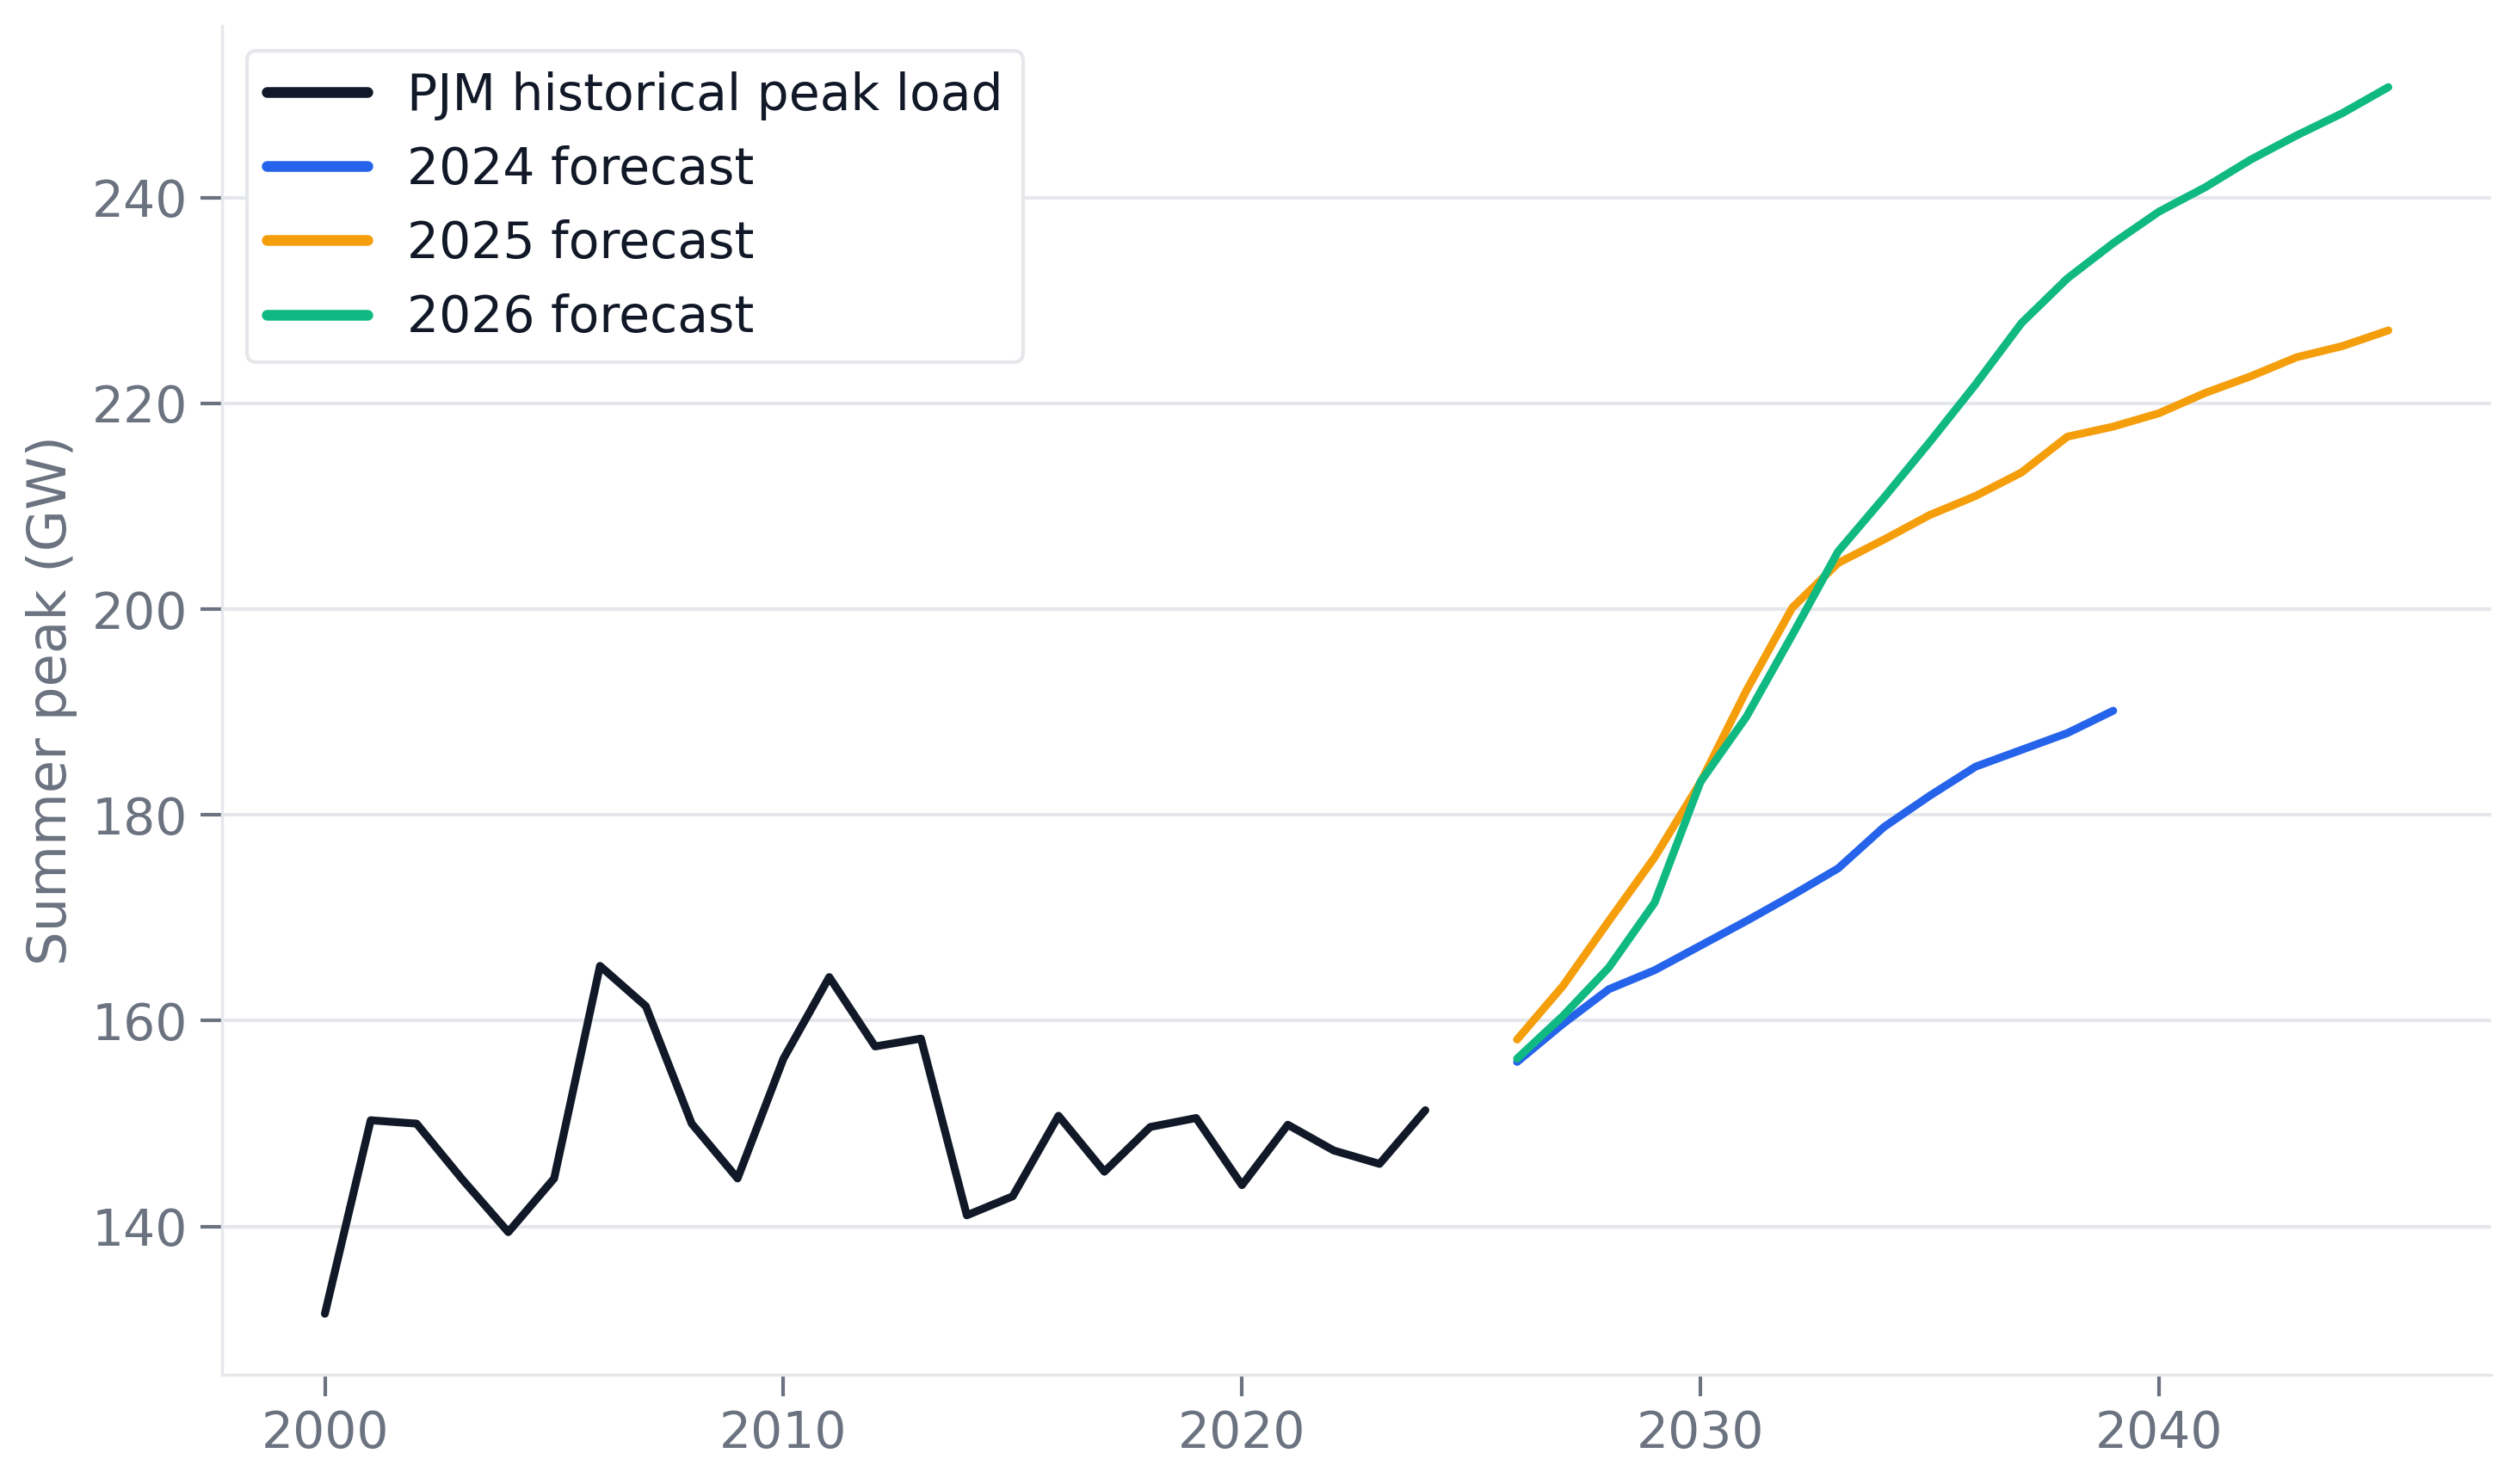
On January 14, PJM Interconnection released their 2026 Load Forecast Report, raising their peak load expectations in 2034 onward compared to last year's forecast. The grid operator, which serves 67 million customers in the Mid-Atlantic region, is home to the largest concentration of data centers in the world. As electricity bills in the region continue to rise, many point fingers at data centers for driving up demand and costs. On January 15, Chris Wright and Doug Burgum, on behalf of the White House Energy Dominance Council, along with the governors of all 13 states in the PJM footprint, signed a letter urging PJM to host a one-time emergency auction to procure new capacity resources. The letter calls for the costs of this auction to be allocated to new data centers that have not procured their own new capacity. Source: PJM.